4.1 License Usage
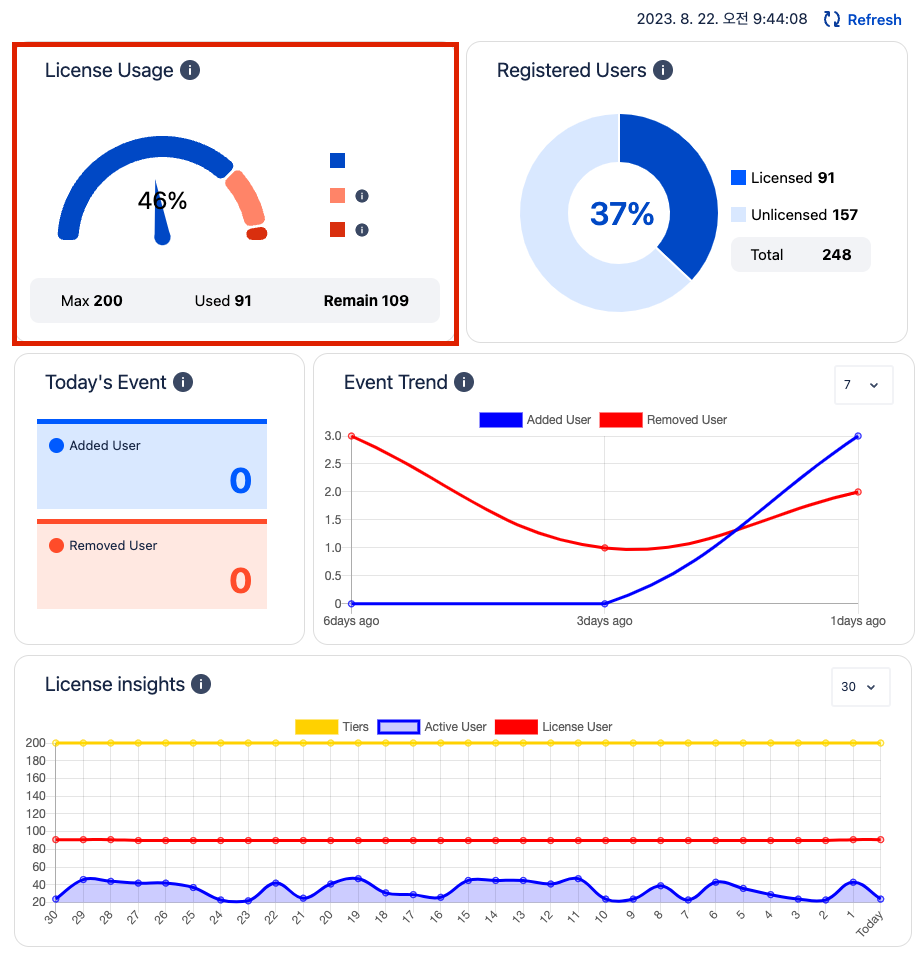
The current usage of purchased Jira Licenses purchased Confluence Licenses is displayed as a colored Gauge Graph
1. The needle on the gauge graph represents the current Jira current Confluence license usage percentage, and the color of the arrow and the color of the graph will change based on the license usage percentage.
a. "Blue color" represents a stable license rate using of less than 75% of Jira of Confluence License.
b. "Orange color" or "Red color" represents the number of unused(remaining) licenses from the total Jira Licenses purchasedtotal Confluence Licenses purchased.
3. You can check the value of each status in the form of a tool tip when the mouse cursor is put over the chart.
4.2 Registered Users
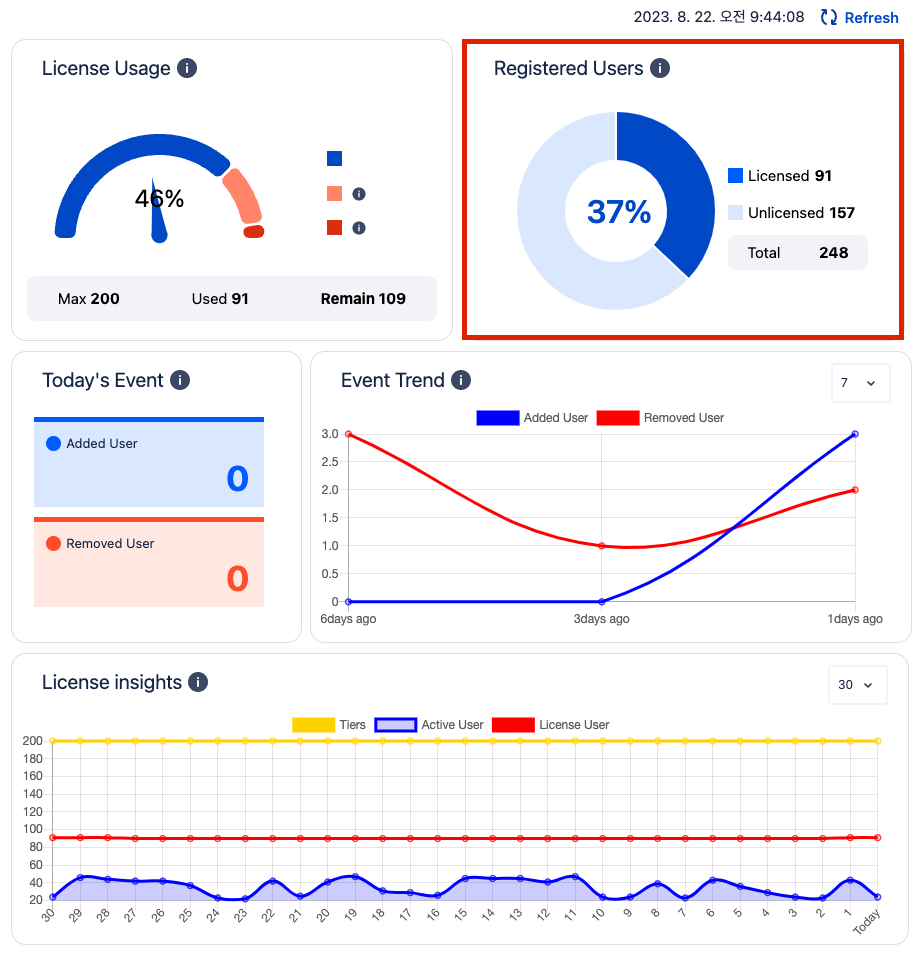
The current usage status of Jira Licenses of Confluence Licenses by registered users is displayed using the colored Pie graph.
1. The number in the pie chart represents the total number of registered Jira Usersregistered Confluence Users.
2. The color of the pie chart shows the current usages of Jira Licenses of Confluence Licenses by registered users.
a. "Dark color" represents the number of licenses used by the registered Jira Usersregistered Confluence Users.
b. "Light color" represents the number of licenses not used by the registered Jira Usersregistered Confluence Users
3. You can check the value of each status in the form of a tool tip when the mouse cursor is put over the chart.
4.3 Today's Event
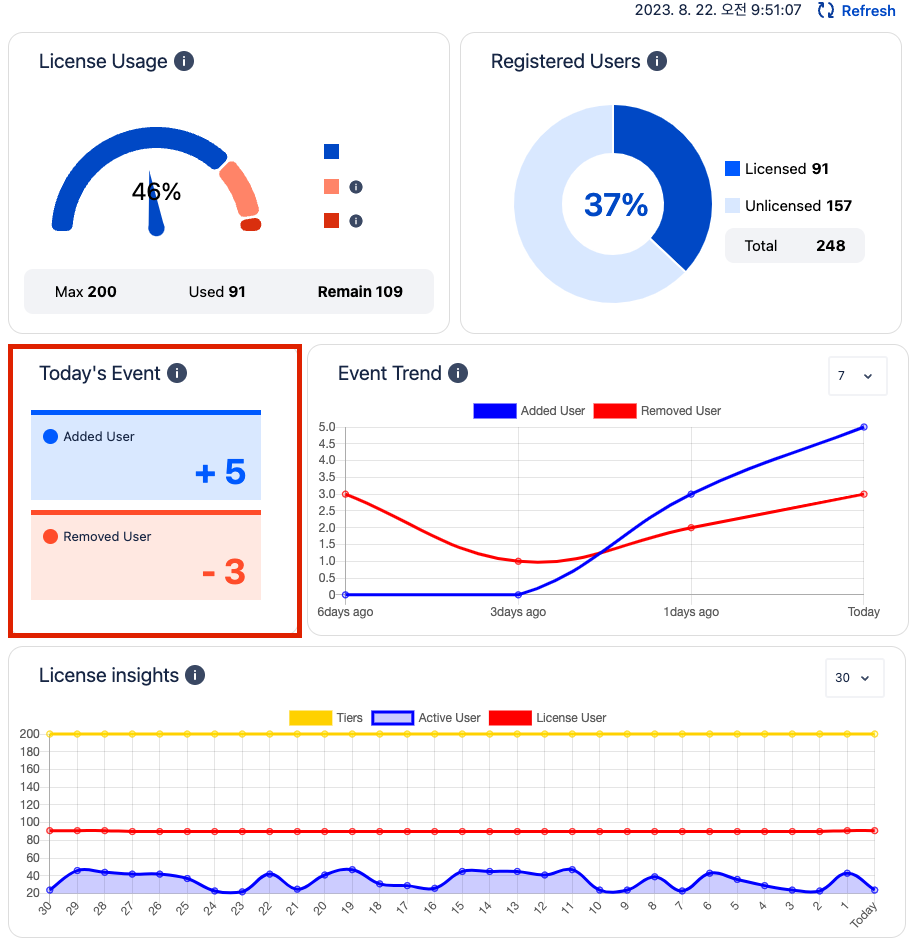
The number of users added and deleted from Access groups through Flexible User Licenses during the day is displayed.
1. The "red" box represents the number of users added through the Flexible User License app today. (Example: + 5)
2. The "blue" box represents the number of users deleted through the Flexible User License app today. (Example: - 5)
4.4 Event Trend
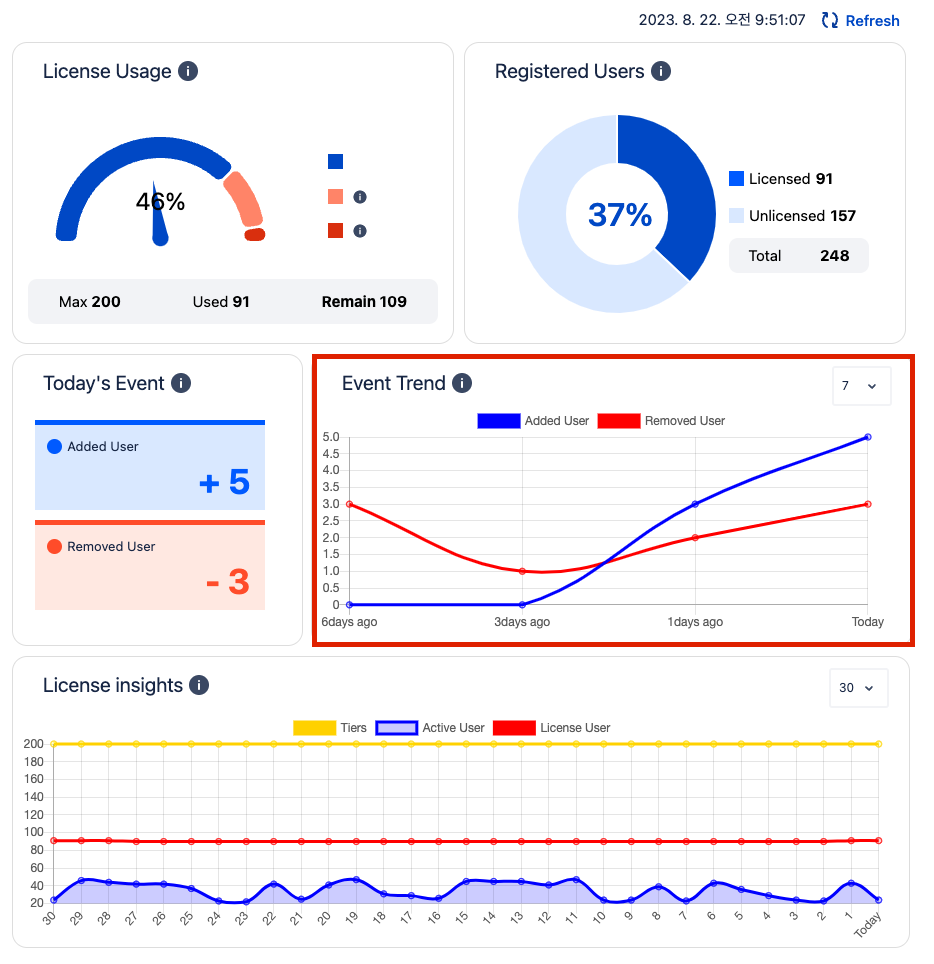
In the past 7 days / 30 days, the number of users added and deleted from the Access group through Flexible User Licenses is displayed on the line graph.
1. The "Red" line represents the number of users added through the Flexible User License app today.
2. The "Blue" line represents the number of users deleted through the Flexible User License app today.
4.5 License Insights
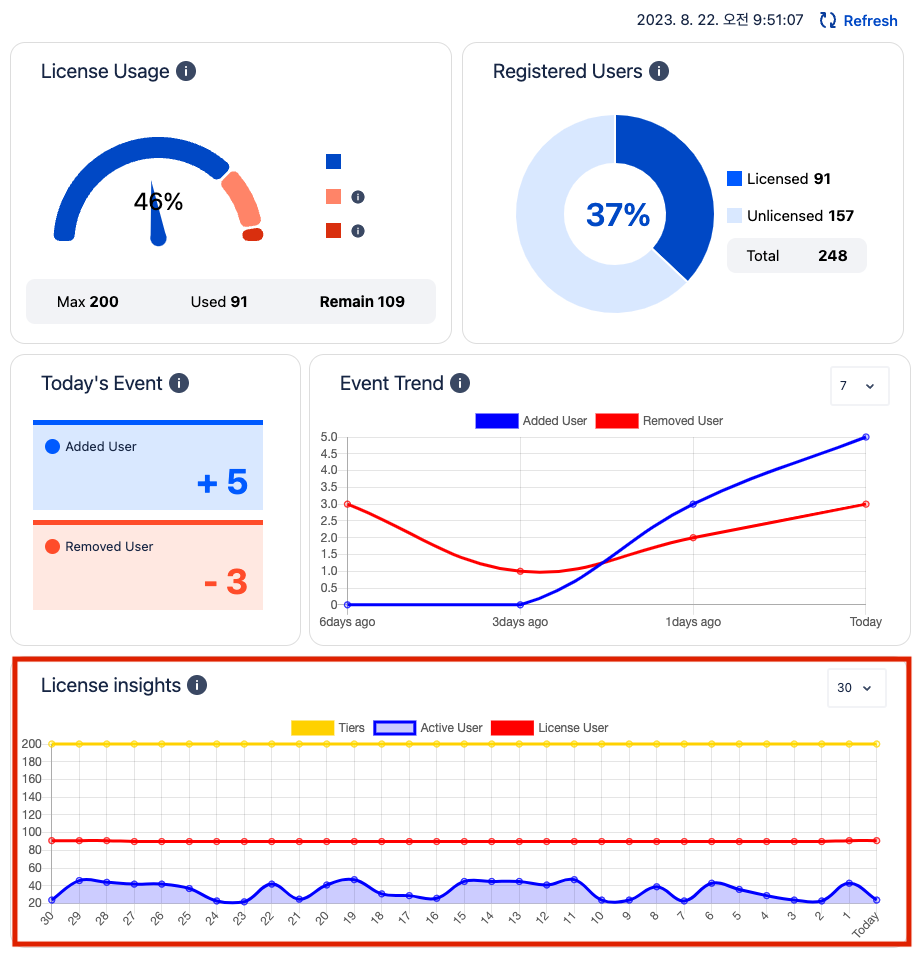
A line graph showing the number of seats, number of Jira of Confluence access users, and number of active users on your Atlassian Jira Atlassian Confluence site over the past 7 days / 30 days.
1. The "Yellow" line represents the number of Seats on your Atlassian Jira Atlassian Confluence site.
2. The "Blue" line represents the number of Jira of Confluence access users on the Atlassian Jira Atlassian Confluence site.
3. The "Red" line represents the number of active users on the Atlassian Jira Atlassian Confluence site.